


.png)

18
Context
Evaluating a GraphRAG assistant is not a one-shot check, it spans several distinct question types, including factoid, multi-hop, contextual summary, and creative generation, as categorized by benchmarks like Evoke / GraphRAG-Bench. The ingestion and generation steps required to answer each question type correctly can vary significantly. Any evaluation process that ignores this diversity risks giving a single, misleading performance number.
At Lettria, our Graph RAG system package already allows to perform document ingestion and chat/inference — and until now, evaluation has been layered on top of it manually:
- Datasets were built collaboratively in LangSmith
- The dataset was fed to the Graph RAG system Inference API to collect answers (and traces).
- Results were stored back in Langsmith where they were evaluated by hand.
This process has three recurring problems:
- Bias, despite blind evaluation. Verbosity and other stylistic cues make it hard to fully prevent human evaluators from guessing which assistant or configuration they're grading.
- Latency. Uploading, configuring the Graph RAG system, running inference, and evaluating manually adds friction at every step, which makes the process slow and hard to study end-to-end.
- No versioning. Without a structured, versioned record of evaluations, it's difficult to track performance over time or compare configurations reliably.
In short: we were missing a mechanism to measure our real-time RAG performance — and without that, we had no reliable way to know which lines of improvement to prioritize.
Motivation / Objective
Our goal is simple: build a reliable, automated evaluation process that helps Data Science and ML engineers compare changes, track versions, and identify what to investigate next.
Manual evaluation remains essential for uncovering complex issues, but the tool should save time by guiding us toward the areas that deserve deeper investigation.
Part I — The Data
Before talking about the tool that scores our system's performance, it's worth starting with what we scored it against — because an evaluation is only as trustworthy as the dataset it relies on.
A quick note on vocabulary
Two terms come up throughout this article and are worth distinguishing upfront. System refers to the overall GraphRAG pipeline — the logic shared across all use cases. Assistant refers to a specific ingestion process bound to a given domain (Legal, Medical, Finance, CSRD — see table below). Each assistant is built on the same underlying system but ingests and indexes a different corpus, so its performance is evaluated independently.
Why build our own datasets rather than use academic benchmarks
Academic GraphRAG benchmarks are a useful reference point, but they weren't the right foundation for this evaluation. Academic corpora tend to be clean, well-structured, and comparatively "easy": consistent formatting, mostly plain text, curated for readability. That's not what our GraphRAG assistants actually face in production. Client documents are messy in the way real-world documents are messy — tables that break across pages, inconsistent structure, dense technical content sitting next to loosely formatted content — and an evaluation built on clean academic text would systematically overstate how well an assistant performs in the field.
So instead, we built homemade datasets from documents that are representative of what clients actually send us. The trade-off is real — homemade datasets are more expensive to build and validate than downloading an existing benchmark — but they're the only way to get a performance signal we can actually trust and act on. Going forward, we also plan to run our system against established academic benchmarks — not to replace our own evaluation, but to give us a reference point for how we compare to other GraphRAG solutions.
Document corpus
Concretely, this meant deliberately sourcing a corpus that reflects the diversity of real client data, along two axes:
- Multimodality. The team put a specific effort into gathering documents that mix tables, multi-column page layouts, images, and charts — not just running text. This matters because these elements are exactly where ingestion and retrieval tend to break down, and a dataset built only on plain-text documents would never surface those failure modes.
- Register and technicality. Documents range from general-audience material to fairly technical, domain-specific content. This mix stresses the assistant differently depending on how much domain vocabulary and implicit prior knowledge is needed to answer correctly.
In total, the corpus spans 66 documents and roughly 2,000 pages, distributed across the four domains (Legal, Medical, Finance, CSRD) as follows:
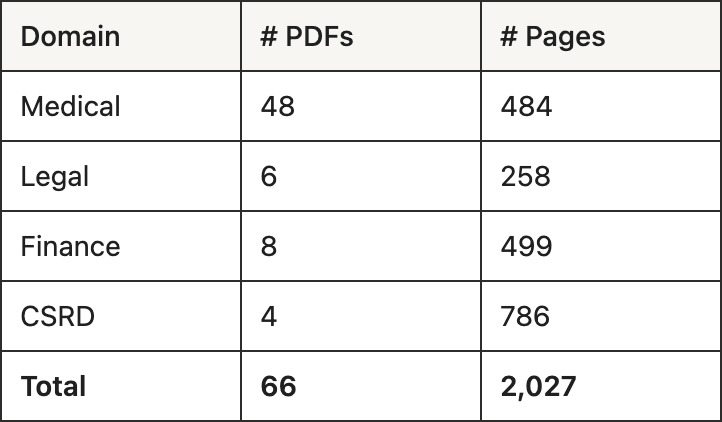
This scale and diversity is what makes the resulting evaluation meaningful for prioritization — it's not a proxy metric on easy data, it's a reasonably faithful stand-in for what the assistant sees in production.
Dataset creation in LangSmith
Datasets are built collaboratively across engineers and linguists at Lettria, using LangSmith as the shared workspace. Two things matter beyond just writing questions:
- Adding elements that will later support evaluation (both human and automatic): the ground-truth answer broken down into atomic facts (generated automatically, then manually reviewed), along with source references — the exact text, page number, and content type (table, paragraph, etc.) the answer is grounded in.
- Adding descriptive fields that will later be used in visualization and filtering — query type, domain, temporal sensitivity, and so on.
These two additions serve different purposes. The ground-truth answer and its atomic facts are what make automated scoring possible once candidate answers exist. Source references serve a different role: they're not used by the automated scoring itself, but they let a human quickly diagnose why a given answer scored the way it did — was the right passage retrieved at all, was it a table the assistant misread, and so on. The descriptive fields, meanwhile, are what make results actionable afterward — breaking performance down by query_type, for example, lets us go beyond saying "the system scores X on average" and instead say "the system is strong on factoid questions but weaker on comparative ones."
One important factor to monitor is the verbosity of the ground-truth answers. More verbose answers tend to contain more atomic facts, and they lengthen the context that automated scoring methods have to process — both of which can introduce noise unrelated to actual system performance. Ground-truth verbosity should therefore remain reasonably consistent across the dataset to ensure fair comparisons.
Methodology
Queries and ground-truth answers were carefully annotated based on the actual content of the corpus. Annotators first identified relevant elements in the source documents— including tables, charts, and images, not only plain text — and then created queries whose answers could be directly verified against the original material.
The query set covers different query types: factoid, multi-hop, global synthesis, unanswerable, comparative, quantitative, temporal reasoning, ordering, causal inference, hypothetical, and provenance/citation. This ensures that each query and ground-truth answer is grounded in the corpus and reflects the different types of information an assistant may need to retrieve and reason over — giving us not only how well an assistant performs, but also where and why its performance differs across domains and question types.
Distribution of query types by domain
The following graph presents the distribution of query types across the 99 queries.
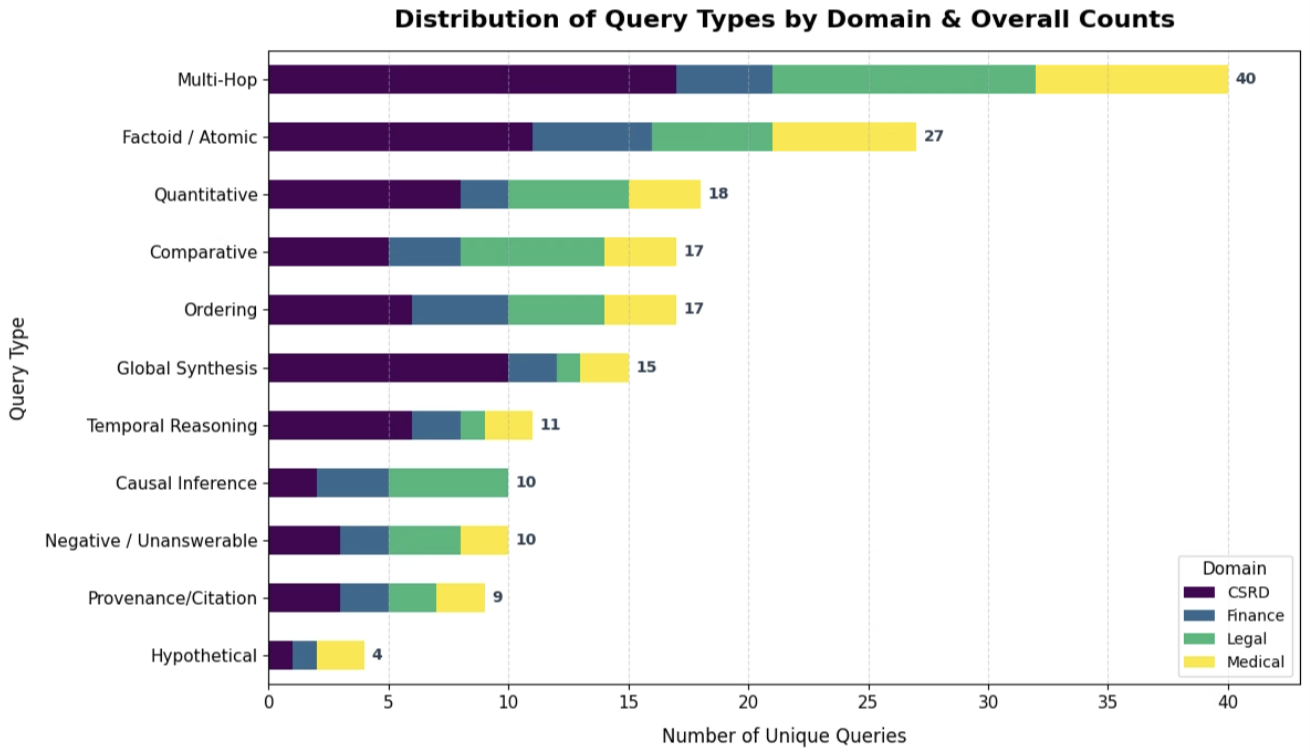
The query set skews heavily toward reasoning-heavy question types rather than simple lookups. Multi-hop questions are the most common tag (40 occurrences) — well ahead of Factoid/Atomic (27) — reflecting a deliberate choice to stress-test retrieval and synthesis across multiple passages rather than just single-fact recall. This distribution is intentional: the goal is for the dataset to mirror what clients actually ask in production, not to cover every query type equally. Factoid and Multi-hop questions dominate because they reflect the bulk of real usage, while Hypothetical questions remain rare (4) because they're not yet a common client request . Quantitative, Comparative, and Ordering questions form a solid second tier (17–18 each) and round out the mix.
Note: queries are multi-label — a single query can be tagged with more than one query type (e.g. both "Comparative" and "Temporal Reasoning"), which is why the counts in the chart sum to more than the 99 total queries in the dataset.
With the datasets built, we can now generate candidate answers on any given assistant — which is what the automatic evaluation system, covered in Part II, actually scores.
Part II — The Evaluators: GRAPE
With a dataset we trust in hand, the next question is how to actually score answers against it — reliably, and without a linguist manually re-reading every sample.
Presentation of the tool
To meet this objective, the Data-Science team built GRAPE (Graph RAG Performance Evaluation), an internal tool dedicated to running evaluations. Evaluators take a dataset as input and produce metrics as output; different evaluators trade off cost, speed, and granularity of insight.
GRAPE currently ships two end-to-end evaluators — these are the only ones used in this experimentation so far:
- Naive End-to-End is a fast, low-cost estimate: an LLM-as-judge compares the candidate answer directly against the ground truth and returns a single 0-to-1 semantic-similarity score. It's cheap, but a black box — a 0.65 means "roughly two-thirds right," without saying which two-thirds.
- Atomic Fact–based trades speed for detail:
- Decomposes both the candidate and ground-truth answers into individual, weighted factual claims.
- Checks whether each ground-truth fact is present in the candidate (recall) and each candidate fact is present in the ground-truth (precision), using each fact's weight to compute the final score.
- Combines both into a single F1 score.
.png)

The architecture is deliberately extensible: the repository is built so that new automatic evaluators (custom, API-based, or third-party frameworks like RAGAs) can be added without disrupting existing ones.
From evaluation POC to repository architecture
The first version of this evaluation approach was a proof of concept, used to validate the general method before investing in a proper architecture. That POC wasn't a structured piece of software — it was a basic collection of loose scripts and files, run more or less by hand. It was enough to validate that the method itself (Naive E2E and Atomic-Fact scoring against a LangSmith dataset) produced usable signal, but it wasn't something we could build a repeatable process on.
GRAPE is the answer to that: a proper repository following Clean Architecture, since it needs to integrate with several external systems — reading prompts, exporting results, and reading datasets from different sources.
Compared to that initial collection of scripts, a structured repository:
- handles concurrency and tracing far more cleanly, which matters once you're running dozens of samples across multiple configurations in parallel;
- is testable, versionable, and reusable across evaluation campaigns, rather than being a one-off, hard-to-reproduce set of files.
Reproducibility: are the evaluators themselves stable?
Before trusting any evaluator's output enough to base decisions on it, we needed to answer a more basic question: if we run the same evaluation — same dataset, same evaluator — multiple times, do we get the same result? An evaluator that swings wildly from run to run would be useless for comparing configurations, since we'd never know whether a score difference reflects a real performance gap or just noise in the evaluator itself. Again, we wanted a reliable automatic evaluation process.
To check this, we ran the same evaluation dataset through the same evaluator repeatedly and measured the spread of results. For the Naive End-to-End evaluator, this gave a run-level standard deviation of <0.005 across 5 repeated runs — highly stable, and small enough to be confident that differences observed between configurations reflect real performance gaps rather than evaluator noise. This stability check is what justifies relying on these evaluators for configuration comparisons in the first place, rather than treating their scores as a rough approximation.
Data validation with Pydantic
Because GRAPE consumes external datasets built by different contributors in LangSmith, it relies on Pydantic to continuously validate input data — specifically, to make the process crash as fast as possible when a dataset is inconsistent or doesn't match expectations, rather than silently producing corrupted or misleading metrics further down the pipeline.
Two concrete cases this catches:
- Missing required fields. If a contributor forgets to provide a
ground_truth_answer(or any other field the evaluation depends on), the process crashes immediately at validation, rather than several steps later with a confusing downstream error — or worse, silently scoring against an empty reference. - Malformed descriptive columns. We use descriptive columns such as
query_type,query_scope, and temporal flags to aggregate and analyze evaluation results. Since the configuration can specify which columns should be used for aggregation and grouping, their values need to follow a consistent, expected format. Pydantic catches inconsistent or unexpected values during validation, before they can silently lead to incorrect aggregated tables or filtered views downstream.
Evaluation Pipeline
Evaluation starts from a single base dataset containing the queries and ground-truth answers. For each experiment, a separate candidate dataset is created externally by the system or assistant being evaluated, combining the base data with:
- candidate answers, generated externally by the system or assistant being evaluated;
- atomic facts and their associated weights, when required by a more fine-grained evaluator;
- additional descriptive metadata used to segment and analyze results.
The dataset becomes ready for assessment once all fields required by a given evaluator are available. Different approaches carry different requirements: a naive end-to-end method, for instance, can directly compare a candidate answer against its ground truth, while one that checks atomic facts additionally needs the corresponding facts to perform a more fine-grained comparison.
Looking ahead, the evaluation workflow should make it possible to run and compare multiple configurations, and export results in different formats. In particular, exporting results to MLflow makes it possible to compare different assistants or configurations, store evaluations remotely for collaborators to access, and analyze aggregated results across descriptive dimensions such as query type or scope.
Part III — Run & Results
With the dataset and the tool both validated, we could finally put GRAPE to work on a real comparison.
Configurations under test
Five chat configurations were evaluated, built as variations around a single reference configuration:
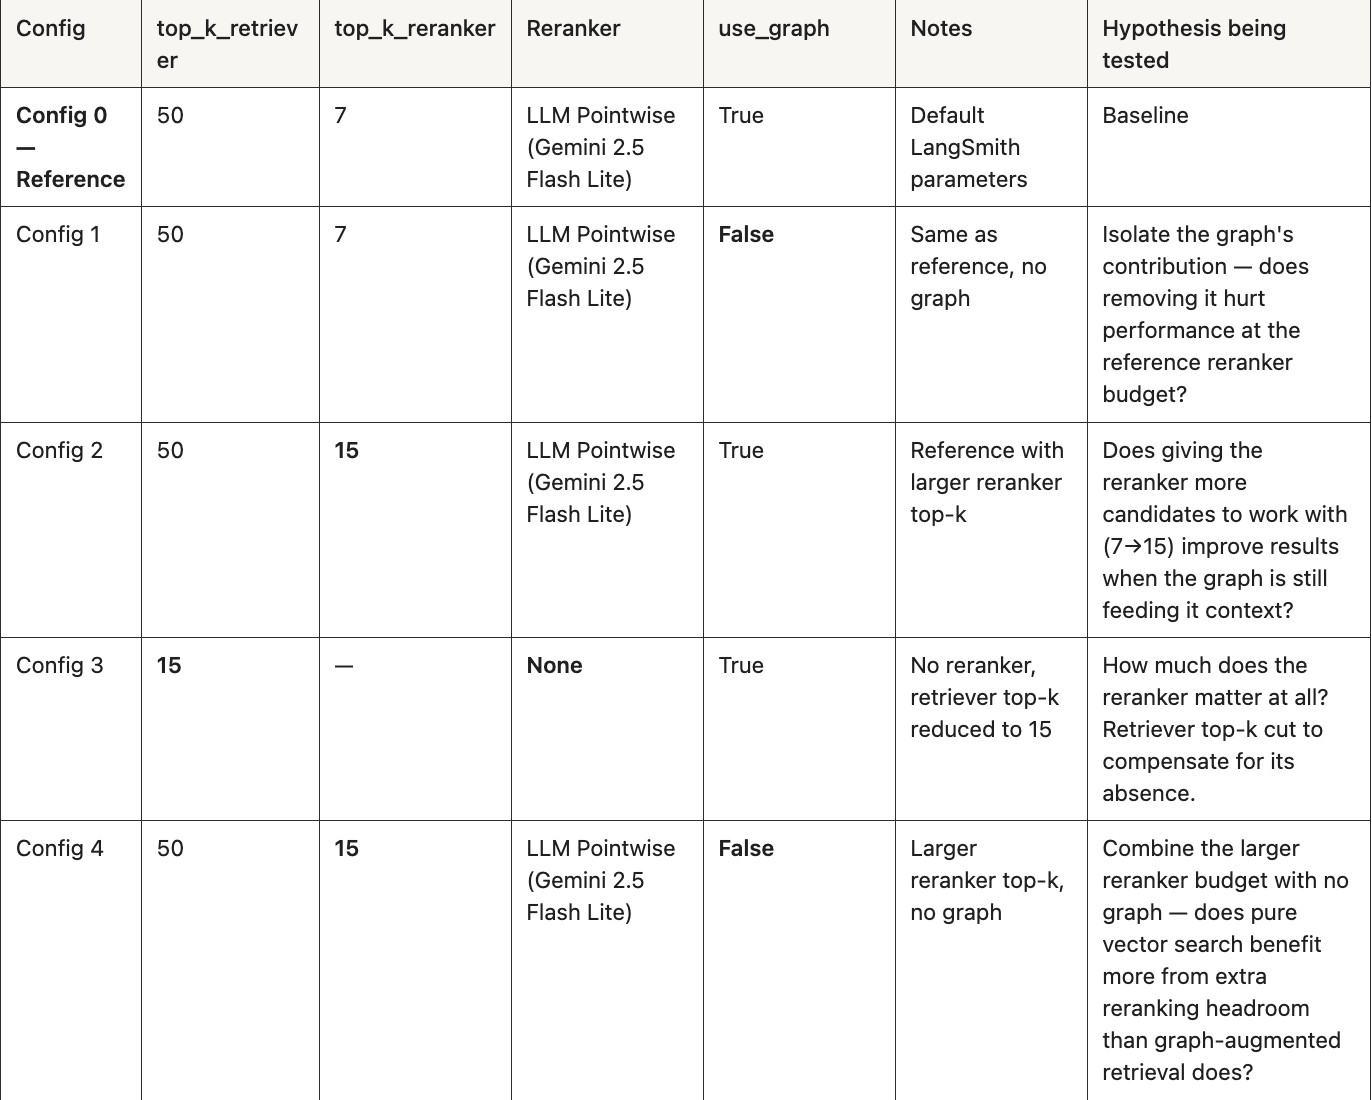
Naive End-to-End results
Here are distribution charts about the Reference configuration:

The first chart breaks down Naive End-to-End scores by domain. Two things stand out. First, the distribution is bimodal rather than centered around a mid-range score — across all domains combined, answers cluster heavily near 1.0 (50 of 99 queries) or near 0.0 (13 queries), with comparatively few scoring in the 0.4–0.8 "partial" range.
Second, performance varies meaningfully by domain: Medical (0.770) and Legal (0.737) score well above Finance (0.574) and CSRD (0.608) — but the two lower-scoring domains get there differently.
- CSRD's lower average is driven largely by a heavier concentration of partially-correct answers: roughly 47% of CSRD queries fall in the mid-range (0.1–0.9), well above the 20–37% seen in the other three domains.
- CSRD also carries a disproportionate share of Multi-Hop and Global Synthesis queries — complex query types that require retrieving and synthesizing many chunks, which aren't always all retrieved successfully — and which contribute to CSRD's weaker scores overall.
- Finance's shortfall has a different shape — it has the highest outright-failure rate of any domain (21% of queries scoring near 0.0).
In short: CSRD struggles most with partial, incomplete answers, while Finance struggles more with answers that fail outright.
Distribution of Mean Naive end-to-end scores across all domains
.png)
The second chart breaks the same Reference-configuration results down by query type instead of domain, classifying each answer as Success, Partly Failed/Incomplete, or Fail. This view makes the domain-level pattern more actionable: Negative/Unanswerable (100% success, 10/10) and Causal Inference (90% success, 9/10) are the strongest query types, while Global Synthesis (27% success), Hypothetical (25% success) and Ordering (24% success) are the weakest. Multi-Hop, despite being the largest category (40 tagged queries), sits in the middle at 52.5% success — a meaningful chunk of failures given how heavily it's represented in the dataset. Section “Qualitative analysis of failures” gives more insights as to why these particular categories yield worse results.
Comparing configurations
Before comparing configurations, we first checked that the evaluation itself was reliable. For Config 0, we generated 5 independent evaluation runs on the same candidate dataset:
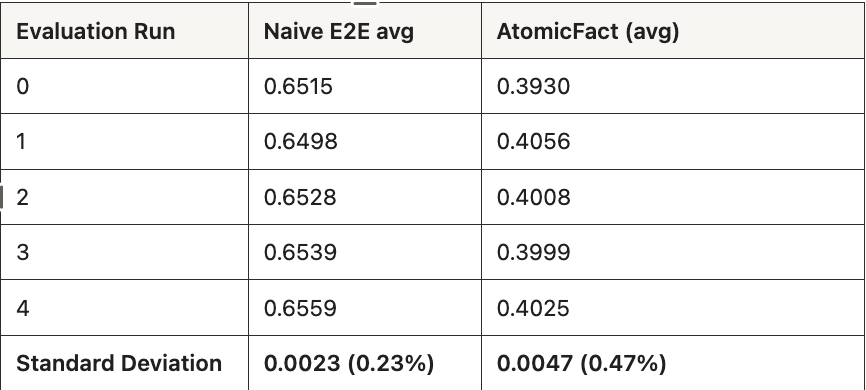
With the candidate answer frozen, we also looked at agreement at the individual query level:
- Naive End-to-End self-agreement: 52.5% of queries (52/99) score identically across all 5 runs (std = 0.00). Average query-level std is 0.0189 (1.89%).
- Atomic Fact self-agreement: 65.7% of queries (65/99) are perfectly stable. Average query-level std is 0.0124 (1.24%).
In other words: re-running the exact same evaluation moves the overall score by less than 0.5% for Atomic Fact and less than 0.25% for Naive E2E. The evaluator itself is not the source of noise.
Once we confirmed the evaluation pipeline was stable, we generated five candidate datasets per configuration — regenerating the assistant's answers each time — to see how much variance came from the RAG system itself rather than from grading.
The true source of noise is the assistant, not the grader. When candidate answers are regenerated across runs, the average query-level standard deviation is 8.6% — and a small tail of hard queries (18 of 495, or 3.6%) swings much further, with peaks up to 55% (clean pass on one run, clean fail on the next). When we instead freeze the candidate answers and only re-run the grader, both numbers collapse: average query-level std drops to 1.89%, and the worst-case query never exceeds 10%.
In other words, whether you look at the typical query or the worst-case query, freezing the answers cuts noise by roughly 4.5–5.5x. That's strong evidence the volatility we see isn't the evaluator being inconsistent — it's the RAG assistant itself producing genuinely different answers across regenerations on its hardest queries.
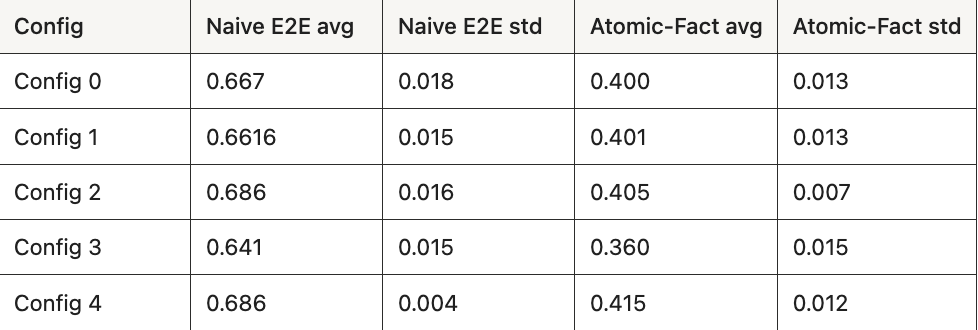
Reading the configuration table:
- Reranker top-k matters. Going from
top_k_reranker=7to15improved Naive E2E scores by +1.9 points with the graph enabled (Config 0 → Config 2) and +2.4 points without it (Config 1 → Config 4). - Config 4 is the strongest configuration overall — not because it beats Config 2 on Naive E2E (they tie at 0.686), but because it's far more stable (std 0.004 vs 0.016) and scores noticeably higher on Atomic-Fact (0.415 vs 0.405, +1.0 percentage point).
- Removing the reranker hurts the most. Config 3 (no reranker, retriever top-k reduced to 15) is the clear worst performer: 0.641 Naive E2E and 0.360 Atomic-Fact, well below every other configuration.
- The graph's effect is context-dependent. At the smaller reranker budget (top-k=7), the graph gives a small boost (Config 0 vs Config 1: 0.667 vs 0.662). At the larger budget (top-k=15), it's the opposite — dropping the graph (Config 4) slightly outperforms keeping it (Config 2), particularly on Atomic-Fact. This suggests that at larger context sizes, graph community summaries and relations may crowd out precise, exact-match facts during reranking rather than adding value.
Qualitative analysis of failures
Manual examination of incorrect samples surfaced several recurring failure patterns:
- Contradictions within a single answer were observed in some cases, particularly when the generation context was large or noisy. However, similar inconsistencies occasionally appeared even with relatively small and focused contexts, suggesting that context quality is not the only factor. Limited model reasoning capabilities — or the absence of explicit reasoning — may also contribute.
- Hypothetical questions are often handled poorly. In some cases, the model fails to perform the relatively simple reasoning or computation required to derive the answer. Although noisy or incomplete context can make these questions harder, failures were also observed with small contexts containing the necessary information, suggesting that the issue may partly stem from the model itself or from its reasoning strategy.
- Comparative / ordering questions frequently fail because the retrieved context is missing information about one or more of the elements being compared or ordered. However, retrieval is not necessarily the only source of error: even when the relevant information is available, the model may struggle to correctly combine, compare, or order it.
- Graph-sourced elements can introduce additional noise into the generation context, although enabling graph retrieval still slightly improves overall performance on average. This suggests that the graph provides useful information, but that its contribution could benefit from better filtering, ranking, or integration into the final context.
Conclusions
From the configurations tested so far:
- Reranking helps. Configurations with a reranker outperform the one without (Config 3).
- Reranker top-k matters more than retriever top-k in this range. Going from
top_k_reranker = 7to15(withtop_k_retriever = 50) gave better results than reducingtop_k_retrieverto 15 without reranking. - Graph usage is a net positive, but not unconditionally. On average, using the graph performs slightly better, but it can sometimes hurt results — consistent with the "noisy graph elements" observation from the failure analysis above.
Limits
- Sample size. 99 samples is too few to draw statistically confident conclusions, especially once split by query type and domain — some query types don't have enough samples to give a clear signal.
- Ground-truth verbosity drift. Answer verbosity in this run doesn't appear to be as tightly aligned with the original POC's ground truth as intended, which likely affects both Naive E2E and Atomic-Fact scoring.
- Ingestion configurations were not varied. For simplicity, this run only tested inference/chat configurations; ingestion parameters were held fixed, so we can't yet say how much of the performance ceiling is set upstream of the chat pipeline.
Next steps
The failure analysis above translates fairly directly into a prioritized list of fixes:
- Comparative / ordering questions: since the root cause is incomplete context rather than poor reasoning, work is planned in the chat pipeline to better parse the query up front and ensure information about each element to be compared is present in the generation context (likely via better query decomposition and parallel retrieval).
- Noisy / large generation context: implicated in both the comparison and hypothetical-question failure modes — this points toward tightening retrieval precision and/or context construction before generation.
- Reasoning capabilities: some queries require computation or multi-step reasoning. A more capable model, potentially with an explicit thinking budget, could help address these cases.
- Graph relation noise: worth investigating filtering or scoring improvements on graph-sourced elements specifically, given they help on average but hurt in some cases.
Ultimately, the goal is to improve our GraphRAG solution as a whole. The scoring provided by our two end-to-end evaluators, combined with manual investigation of samples from our evaluation dataset, has allowed us to identify clear lines of improvement across the different steps of the GraphRAG pipeline (Ingestion and Generation).
Now that we have both an efficient evaluation tool and a richer evaluation dataset, we can turn these findings into an iterative improvement cycle: apply a change, rerun the relevant parts of the pipeline, and objectively compare before-and-after results to measure the resulting performance gains. Changes affecting the ingestion pipeline will require a new ingestion run, while changes limited to inference can be evaluated by simply relaunching generation.
This closes the loop between evaluation, diagnosis, and improvement: each cycle provides measurable evidence of progress and helps us decide what to prioritize next.
Stay tuned for our next article, where we will put this methodology into practice and unveil the performance gains achieved through the latest updates to our GraphRAG solution!
Frequently Asked Questions
Yes. Lettria’s platform including Perseus is API-first, so we support over 50 native connectors and workflow automation tools (like Power Automate, web hooks etc,). We provide the speedy embedding of document intelligence into current compliance, audit, and risk management systems without disrupting existing processes or requiring extensive IT overhaul.
It dramatically reduces time spent on manual document parsing and risk identification by automating ontology building and semantic reasoning across large document sets. It can process an entire RFP answer in a few seconds, highlighting all compliant and non-compliant sections against one or multiple regulations, guidelines, or policies. This helps you quickly identify risks and ensure full compliance without manual review delays.
Lettria focuses on document intelligence for compliance, one of the hardest and most complex untapped challenges in the field. To tackle this, Lettria uses a unique graph-based text-to-graph generation model that is 30% more accurate and runs 400x faster than popular LLMs for parsing complex, multimodal compliance documents. It preserves document layout features like tables and diagrams as well as semantic relationships, enabling precise extraction and understanding of compliance content.


.jpeg)

.png)