.png)
.jpg)
7 min
Introduction
The representation of information in graphs is now central to RAG systems and other agentic architectures. For graphs to be highly reliable, they must rely on ontologies specifically tailored to the targeted application. However, designing such ontologies manually is both time-consuming and labor-intensive. To address this challenge, Lettria developed Ontology Toolkit, an automated ontology construction module that has become a key component of its solution. To continuously enhance its performance, Lettria’s R&D team regularly updates the tool and recently released Ontology Toolkit v2. A comparative evaluation underscored its progress: the new version outperforms not only its predecessor but also a fully handcrafted reference ontology.
1. Objective
An ontology serves several functions, notably providing the structural framework required for graph creation. In our GraphRAG pipeline, it is supplied to a model to generate semantic graphs from document collections. The ontology and its elements form the backbone for representing knowledge within a graph.
To assess the quality of ontologies produced by Ontology Toolkit v2, we compared the graphs generated from these ontologies to reference semantic networks, described below.
We evaluated two types of ontologies produced by the tool. One feature of Ontology Toolkit is that each step of the pipeline is applied separately to each input document (or document segment, for larger texts), producing an initial ontology called a document-level ontology. As a result, the number of document-level ontologies equals the number of documents.
During the final pipeline stages, these ontologies are consolidated into a single merged ontology. After a series of verification and correction steps, this becomes the unified ontology, intended to capture the entirety of the input data. For each text, we therefore assessed the graph generated using its document-level ontology separately from the graph produced using the unified ontology, allowing us to analyze potential differences.
To measure the progress made with this new version of the tool, we also examined graphs produced from an ontology generated with Ontology Toolkit V1, used here as a baseline.
Finally, to determine how automatically generated ontologies compare with human-designed ones, we also evaluated graphs derived from a handcrafted ontology for the same knowledge domain.
2. Evaluation method
2. 1. Generation steps
2. 1. 1. Corpus selection and use-case definition
Our first task was to select a set of texts belonging to a coherent knowledge domain. For this study, we chose 27 texts from an existing corpus of press articles about corporate financial activities. As in all our projects, the documents were standardized using our in-house preprocessing tool, Document Parsing.
The documents were then processed by the Ontology Toolkit pipeline, accompanied by a customized use case. In this instance, the use case was defined as: “Assess and analyze the impact of market-moving events, the parties involved, and their subsequent consequences.”
2. 1. 2. Generation of semantic networks
Once ingested, each document first goes through the semantic network generation stage of the Ontology Toolkit pipeline. In this phase, each semantic network is a preliminary extraction of information that, after several refinement steps, evolves into a complete ontology. For our evaluation, each of the 27 semantic networks also served as a reference for analyzing the graphs generated from the ontologies.
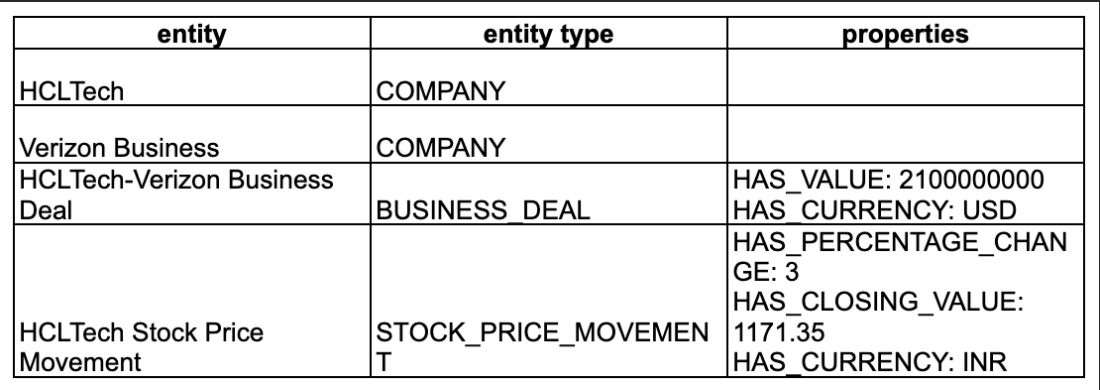
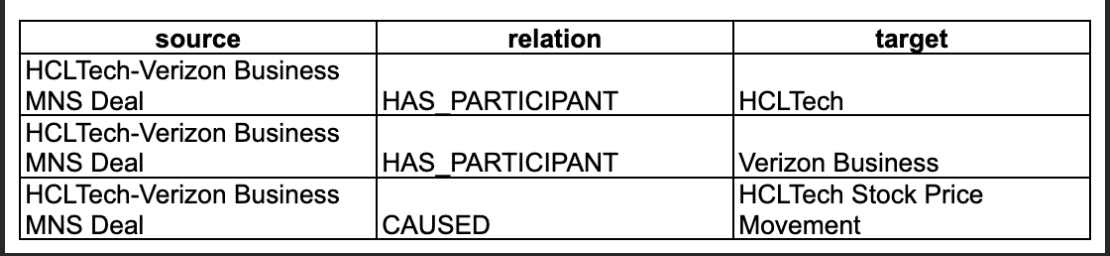
The model produces a list of entities, properties, and relationships identified in the text. Entities correspond to people, organizations, objects, events, or abstract concepts. Each entity is associated with a type, i.e., the category it belongs to. It may also include properties, representing its attributes or descriptors. Relationships define the links between entities. Together, these components form a semantic network.
Consider the following sentence: “HCLTech jumped over 3 percent to close at Rs 1,171.35 after the IT giant signed a deal worth $2.1 billion with Verizon Business.” The corresponding semantic network contains the following elements:
2. 1. 3. Ontology generation
As noted earlier, Ontology Toolkit generates one ontology per input document. Following the construction of the 27 semantic networks and subsequent pipeline steps, the tool produced 27 document-level ontologies, each associated with a single text.
The unified ontology is then created by merging all document-level ontologies. Additional prompt-based procedures verify their consistency and correct any deviations.
To evaluate progress across versions, we also generated an ontology with the Ontology Toolkit V1 pipeline using the same corpus and use case. In this earlier version, the unified ontology is produced directly, without intermediate steps.
2. 1. 4. Graph generation
Graphs are generated using our Text-to-Graph module, powered by our in-house model Perseus. We recently benchmarked its performance for this type of task against other models.
Text-to-Graph converts document content into a knowledge graph based on an ontology schema. Each of the 27 documents therefore produced four graphs: one based on its document-level ontology, one using the unified ontology, one using the v1 ontology, and one using a reference ontology for the finance sector.
In total, 108 graphs were generated. Each graph contained a list of entities, properties, and relations, enabling systematic comparison with the semantic networks.
2. 2. Double evaluation
Results were assessed twice: once automatically and once manually.
2. 2. 1. Automatic evaluation
Automatic evaluation is performed using a dedicated tool with custom prompts. The model checks, for each graph corresponding to a text, whether each element of that text’s semantic network appears in the graph. An element is defined either as an entity with its attributes or as a relation with its source and target entities. This matches each row in the example tables.
A score is assigned as follows:
- 0 — the element is absent;
- 1 — the element is present but incomplete (e.g., less precise or missing attributes);
- 2 — the element is fully present.
For scores of 1 or 2, the evaluator must justify the choice and identify the corresponding graph elements.
Because the same information can be conveyed in different formalizations, the instructions specified that alternative but semantically equivalent representations should not be penalized. For example, the entity HCLTech-Verizon Business Deal could be replaced by a signedADealWith relation between HCLTech and Verizon Business entities; both are considered valid in the context of GraphRAG.
2. 2. 2. Human evaluation
Manual evaluation began by removing elements from each semantic network that fell outside the defined use case in order to avoid skewing graph assessment. The removed items were logged to compute the error rate.
We then reviewed each automatic evaluation, applying the same scoring criteria. In case of disagreement, the score was adjusted, and the difference was recorded to calculate both the disagreement rate and the average score variance.
3. Results
3. 1. Superior results for Ontology Toolkit v2
As shown in the graph below, the graphs produced with ontologies generated by Ontology Toolkit v2 are of higher quality than the others. Graphs derived from the unified ontology achieved an average score of 0.915/2 (0.97 for entities and 0.86 for relationships), corresponding to 45.75% completeness. Graphs produced from document-level ontologies reached an average of 1.63/2 (1.57 and 1.69), i.e., 81.5% completeness.
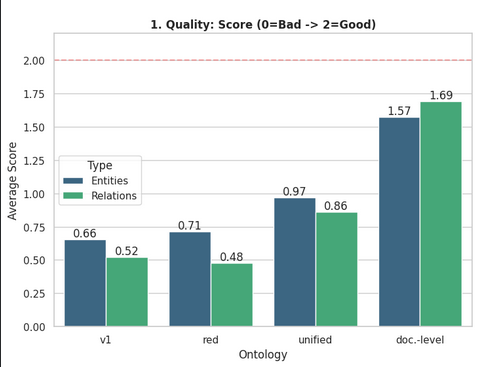
This demonstrates that ontologies generated automatically with Ontology Toolkit v2 can outperform a human-crafted ontology in terms of producing graphs relevant to a specific corpus and use case. Graphs based on the financial reference ontology obtained a lower average score of 0.595/2 (0.71 for entities and 0.48 for relationships), or 29.75% completeness.
The evaluation also highlights the progress made between v1 and v2: graphs created from the v1 ontology obtained the lowest average score, 0.59/2 (0.66 for entities and 0.52 for relationships), or 29.5% completeness, far behind those generated with v2.
However, we observed a reduction in information quality between graphs built from document-level ontologies and those built from the final merged ontology. Our upcoming efforts will therefore prioritize improving the merging process to minimize this loss.
3. 2. Additional observations
3. 2. 1. A high-performance automatic evaluator
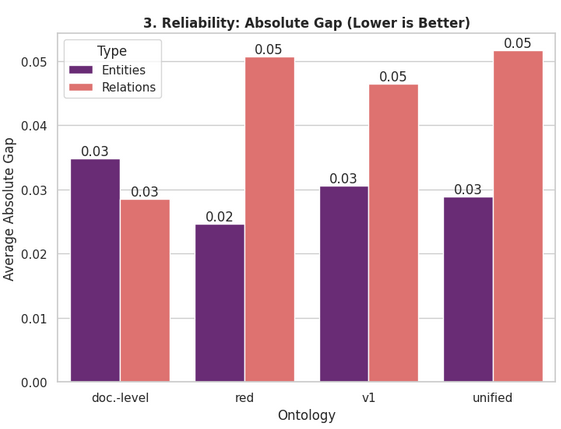
Our study also measured the difference between human and automatic evaluations to assess the reliability of the automated tool. The graph below displays the average score differences for entities and relationships across graph types. The mean difference between human and automatic scores is 0.036/2, meaning the automatic evaluator is over 98% accurate, an excellent result.
3. 2. 2. Overly generous semantic networks
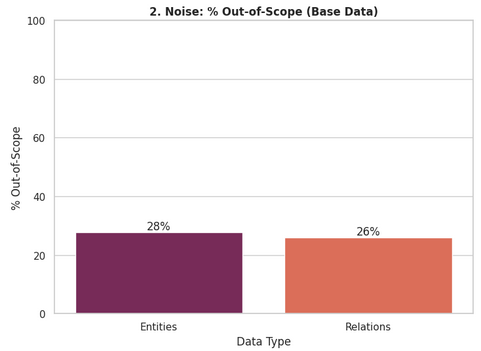
The removal of out-of-scope semantic network elements provides insights into the quality of semantic network generation, a critical step in the Ontology Toolkit pipeline.
The graph below shows that an average of 27% of elements were removed: 28% of entity-plus-property sets and 26% of relation-plus-source-plus-target sets. The risk is that such extraneous information, propagated into document-level ontologies, introduces noise during ontology merging. We hypothesize that because the model must filter and standardize a large volume of information at this stage, irrelevant elements may be retained at the expense of more meaningful ones. This could partly explain the discrepancy between graphs generated from intermediate and merged ontologies.
This aspect represents an avenue for improvement, potentially solvable by better-defined use cases or stricter prompting to enforce use-case alignment.
Conclusion
This evaluation shows that automated ontology generation is no longer just a time-saver—it can now match or even surpass manually crafted ontologies. Ontology Toolkit V2 demonstrates that systematically generated ontologies produce graphs that are more precise, consistent, and aligned with their use case. As agentic AI evolves, these ontologies will become essential for systems that not only retrieve information, but reason, plan, and act on it in complex, dynamic environments.
Frequently Asked Questions
Yes. Lettria’s platform including Perseus is API-first, so we support over 50 native connectors and workflow automation tools (like Power Automate, web hooks etc,). We provide the speedy embedding of document intelligence into current compliance, audit, and risk management systems without disrupting existing processes or requiring extensive IT overhaul.
It dramatically reduces time spent on manual document parsing and risk identification by automating ontology building and semantic reasoning across large document sets. It can process an entire RFP answer in a few seconds, highlighting all compliant and non-compliant sections against one or multiple regulations, guidelines, or policies. This helps you quickly identify risks and ensure full compliance without manual review delays.
Lettria focuses on document intelligence for compliance, one of the hardest and most complex untapped challenges in the field. To tackle this, Lettria uses a unique graph-based text-to-graph generation model that is 30% more accurate and runs 400x faster than popular LLMs for parsing complex, multimodal compliance documents. It preserves document layout features like tables and diagrams as well as semantic relationships, enabling precise extraction and understanding of compliance content.


.png)

.png)
.jpg)